8,77,957 people landed on one D2C fashion brand's Shopify store from Meta ads. 8,09,594 of them left without adding a single product to cart.
That's 92%. And this wasn't a struggling store: the same funnel tracked ₹2.57 crore in sales. Which tells you something most brands miss. Even a store that sells well is losing most of its paid visitors on the product page, before checkout ever begins.
We run the Meta campaigns for this brand. This post is what three years of its funnel data taught us about Shopify conversion rate optimization for Indian D2C brands: where buyers drop, why, and the 12 fixes we check first.
Quick answer: On most Indian D2C stores, the biggest leak is between landing on the product page and adding to cart. The three most common causes we see: the page doesn't match the ad's offer, the price and offer aren't visible on the first mobile screen, and fit or delivery questions go unanswered. Fix those three before you touch checkout.
Skip to the 12 fixes
The real funnel: where 8.7 lakh visitors dropped off
The biggest loss happens before the cart, not at checkout. Here is the brand's full Meta funnel across 921 ads.
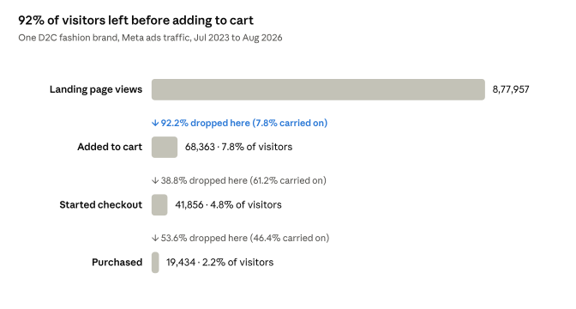
Meta Ads Manager, one D2C fashion brand · Jul 27, 2023 – Aug 27, 2026 · Meta-reported conversions
Once someone added to cart, more than half of them reached checkout, and nearly half of those paid. The product page is where the money leaks.
What is a good ecommerce conversion rate in India?
For fashion and apparel, a conversion rate of around 2–3% of sessions is a fair benchmark, and this brand's 2.2% sits inside that range. Global studies put fashion, accessories and apparel at 2.77% (Dynamic Yield data, June 2026), and all of ecommerce at 1.4% (Statista, Q1 2026), as compiled by Shopify.
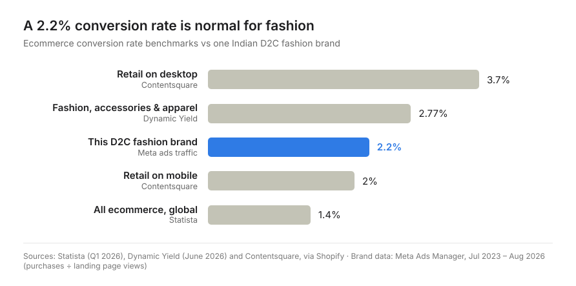
Sources: Statista, Dynamic Yield and Contentsquare via Shopify; brand data from Meta Ads Manager, Jul 2023 – Aug 2026
Three things make Indian D2C numbers behave differently from these global figures:
• Most traffic is mobile. Meta ads send people from Instagram and Facebook on their phones, where conversion runs lower than desktop.
• Cash on delivery decides the sale. Razorpay, citing ET Prime Research (2024), reports that 60–65% of Indian ecommerce orders are placed via COD. If a shopper can't see that COD is available, many won't add to cart.
• A sale isn't final until it's delivered. Razorpay reports return-to-origin (RTO) rates of 25–30% on COD orders versus 2–3% on prepaid. A high conversion rate built on COD can still lose money.
One caution on the comparison: our 2.2% is purchases divided by Meta landing page views, while the global figures count sessions, so treat it as a rough guide. And don't judge your store on conversion rate alone. Read it step by step, which is what the next section shows.
How to find your own leaks in 5 minutes
You already have the data. Two reports show exactly where your store loses buyers.
In Meta Ads Manager:
1. Go to Ads Manager → Ads tab → Columns → Customise columns.
2. Add: Landing page views, Adds to cart, Checkouts initiated, Purchases, Purchases conversion value.
3. Set the date range to the last 90 days and look at the totals row.
In Shopify: go to Analytics → Reports and open the conversion funnel (sessions → added to cart → reached checkout → completed). This includes all traffic, not just Meta.
Now divide each step by the one before it, and use this table to see where to look first: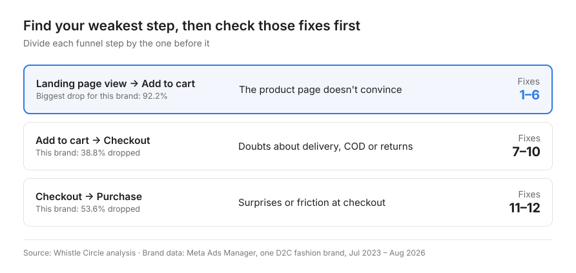
Source: Whistle Circle analysis of one D2C fashion brand's Meta Ads data
Compare against your own past months first. Your trend matters more than any industry average.
12 Shopify CRO fixes for Indian D2C brands
These are the checks we run, in the order buyers hit them. Each one names what we see, why it costs sales, and the fix.
Part A: Why visitors don't add to cart (the product page)
1. The page doesn't match the ad. The ad says "Flat 40% off" or shows a yellow co-ord set; the shopper lands on a collection page, a different colour, or no visible offer. They came for one specific thing, couldn't find it in three seconds, and left. Fix: send each ad to the exact product it shows, and repeat the ad's offer word for word near the price.
2. The first mobile image doesn't sell. A flat product shot on white is what most stores lead with. For fashion, shoppers want to see it on a body. Fix: make the first image an on-model shot, then fabric close-up, then back view. In this account, our best performer was a reel (Reel_1 brought ₹10.66 lakh in tracked sales from 22,736 landing page views); the page it led to should continue that same look.
3. Price and offer sit below the fold. On a phone, the first screen is mostly image. If the price, the discount and the size selector need a scroll, many shoppers never get there. Fix: check your top product page on an actual phone. Price, offer, size and Add to Cart should all be visible or one short scroll away.
4. Sizing is unclear. Baymard Institute found that 87% of mobile apparel sites fail to give enough sizing information, and that sizing doubts were a common reason testers abandoned products. Fix: put the size guide link right next to the size buttons, give measurements in inches and centimetres, and show the model's height and the size they're wearing.
5. The page is slow on mobile data. Google and Deloitte's Milliseconds Make Millions study found that a 0.1-second improvement in mobile site speed lifted retail conversions by 8.4% and spend by 9.2%. Fix: test your product page in PageSpeed Insights, compress images to WebP, and remove apps you no longer use.
6. No believable reviews. Missing reviews, or a wall of identical 5-star reviews, both hurt. Fix: show the rating near the price and real customer photos, and include a few 3–4 star reviews with honest detail ("runs slightly small").
Part B: Why carts don't turn into checkouts
In this account, 39% of people who added to cart never started checkout. These four doubts are what we check first.
7. "When will it arrive?" goes unanswered. Shoppers want a delivery date before they commit. In Baymard's survey, 20% of shoppers abandoned because delivery was too slow. Fix: add a pincode checker that shows an estimated delivery date on the product page.
8. COD isn't shown up front. With 60–65% of Indian ecommerce orders placed on COD (Razorpay, citing ET Prime Research), hiding COD until checkout loses buyers who assume it isn't offered. Fix: show "Cash on Delivery available" as a badge near the Add to Cart button. If RTO is hurting you, offer a small prepaid discount rather than removing COD.
9. The returns policy is hidden or written like a contract. 13% of shoppers in Baymard's survey abandoned because the returns policy wasn't satisfactory. Fix: one line under the button: "Easy 7-day exchange" (use your real terms), linked to the full policy.
10. No quick way to ask a question. Indian shoppers often want to confirm fit, fabric or delivery before buying. Fix: a WhatsApp chat button on product pages. [ADD: your own result or observation from using WhatsApp support, if you have one]
Part C: Why checkouts don't turn into orders
In this account, 54% of people who started checkout didn't complete it.
11. Surprise costs at checkout. This is the biggest reason in Baymard's data: 40% abandoned because extra costs (shipping, taxes, fees) were too high, and 12% because they couldn't see the total cost up front. Fix: show shipping and any COD fee on the product page, not for the first time at checkout. Better still, build the shipping into the price.
12. Too many steps or a forced account. 18% abandoned because the site wanted them to create an account, and 17% because checkout was too long or complicated (Baymard). Fix: allow guest checkout, prefill details where you can, and use a one-page or accelerated checkout. [ADD: which checkout this brand uses, if you can share it]
Which fix first?
Start with the five quick wins: they take a day or two and target the steps where this brand lost the most buyers.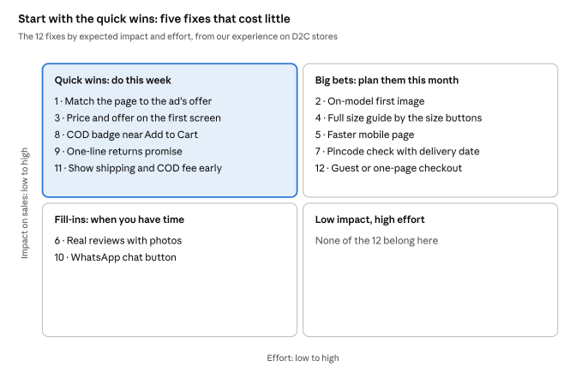
12 fixes by impact and effort · our judgment from D2C stores we work on
Change one thing at a time and give it at least two weeks of traffic. Then compare the same funnel step before and after, so you know which fix actually worked.
This week's checklist:
• ☐ Open your top-selling product page on a phone and screenshot the first screen
• ☐ Check that the ad's offer appears near the price
• ☐ Add a COD badge and a one-line returns promise under Add to Cart
• ☐ Show shipping and any COD fee on the product page
• ☐ Note your current add to cart rate so you can measure the change
Questions D2C founders ask us
What is a good add to cart rate for a Shopify store? There's no single number. In this fashion account, 7.8% of Meta landing page views added to cart. Track your own rate monthly and by product. A product well below your store's average usually has a page problem, not an ads problem.
Is a 2% conversion rate good for an Indian D2C brand? For fashion, it's in the normal range: global apparel benchmarks sit around 2.77% (Shopify). Check it alongside your RTO rate, because a COD-heavy 2% can be worth less than a prepaid-heavy 1.5%.
Should Meta ads go to a product page or a landing page? For a single hero product with a clear offer, we usually send traffic straight to the product page so the buyer is one tap from Add to Cart. A separate landing page makes sense when the product needs explaining. Test both on the same audience before deciding.
Does offering COD increase or decrease profit? COD usually increases orders but also increases returns to origin: Razorpay reports 25–30% RTO on COD versus 2–3% on prepaid. Keep COD visible, confirm COD orders by WhatsApp or SMS, and nudge prepaid with a small discount.
How long does Shopify conversion rate optimization take to show results? Fixes like showing COD, delivery dates and the offer above the fold can move numbers within a few weeks of traffic. Run each change for at least two weeks and compare the same funnel step before and after.
The short version
More ad spend won't fix a product page that loses 92% of visitors. Read your funnel step by step, fix the biggest drop first, and test one change at a time. On most Indian D2C stores, that means the first mobile screen, sizing, delivery dates and COD, before anything at checkout.
Want a second pair of eyes? We'll review one of your product pages against these 12 points and send you a short video with what we'd fix first. Get a free Shopify CRO audit
Related: how we build stores that convert, in our Shopify website development service, and how we run Meta ads for D2C brands.
 LinkedIn
 WhatsApp